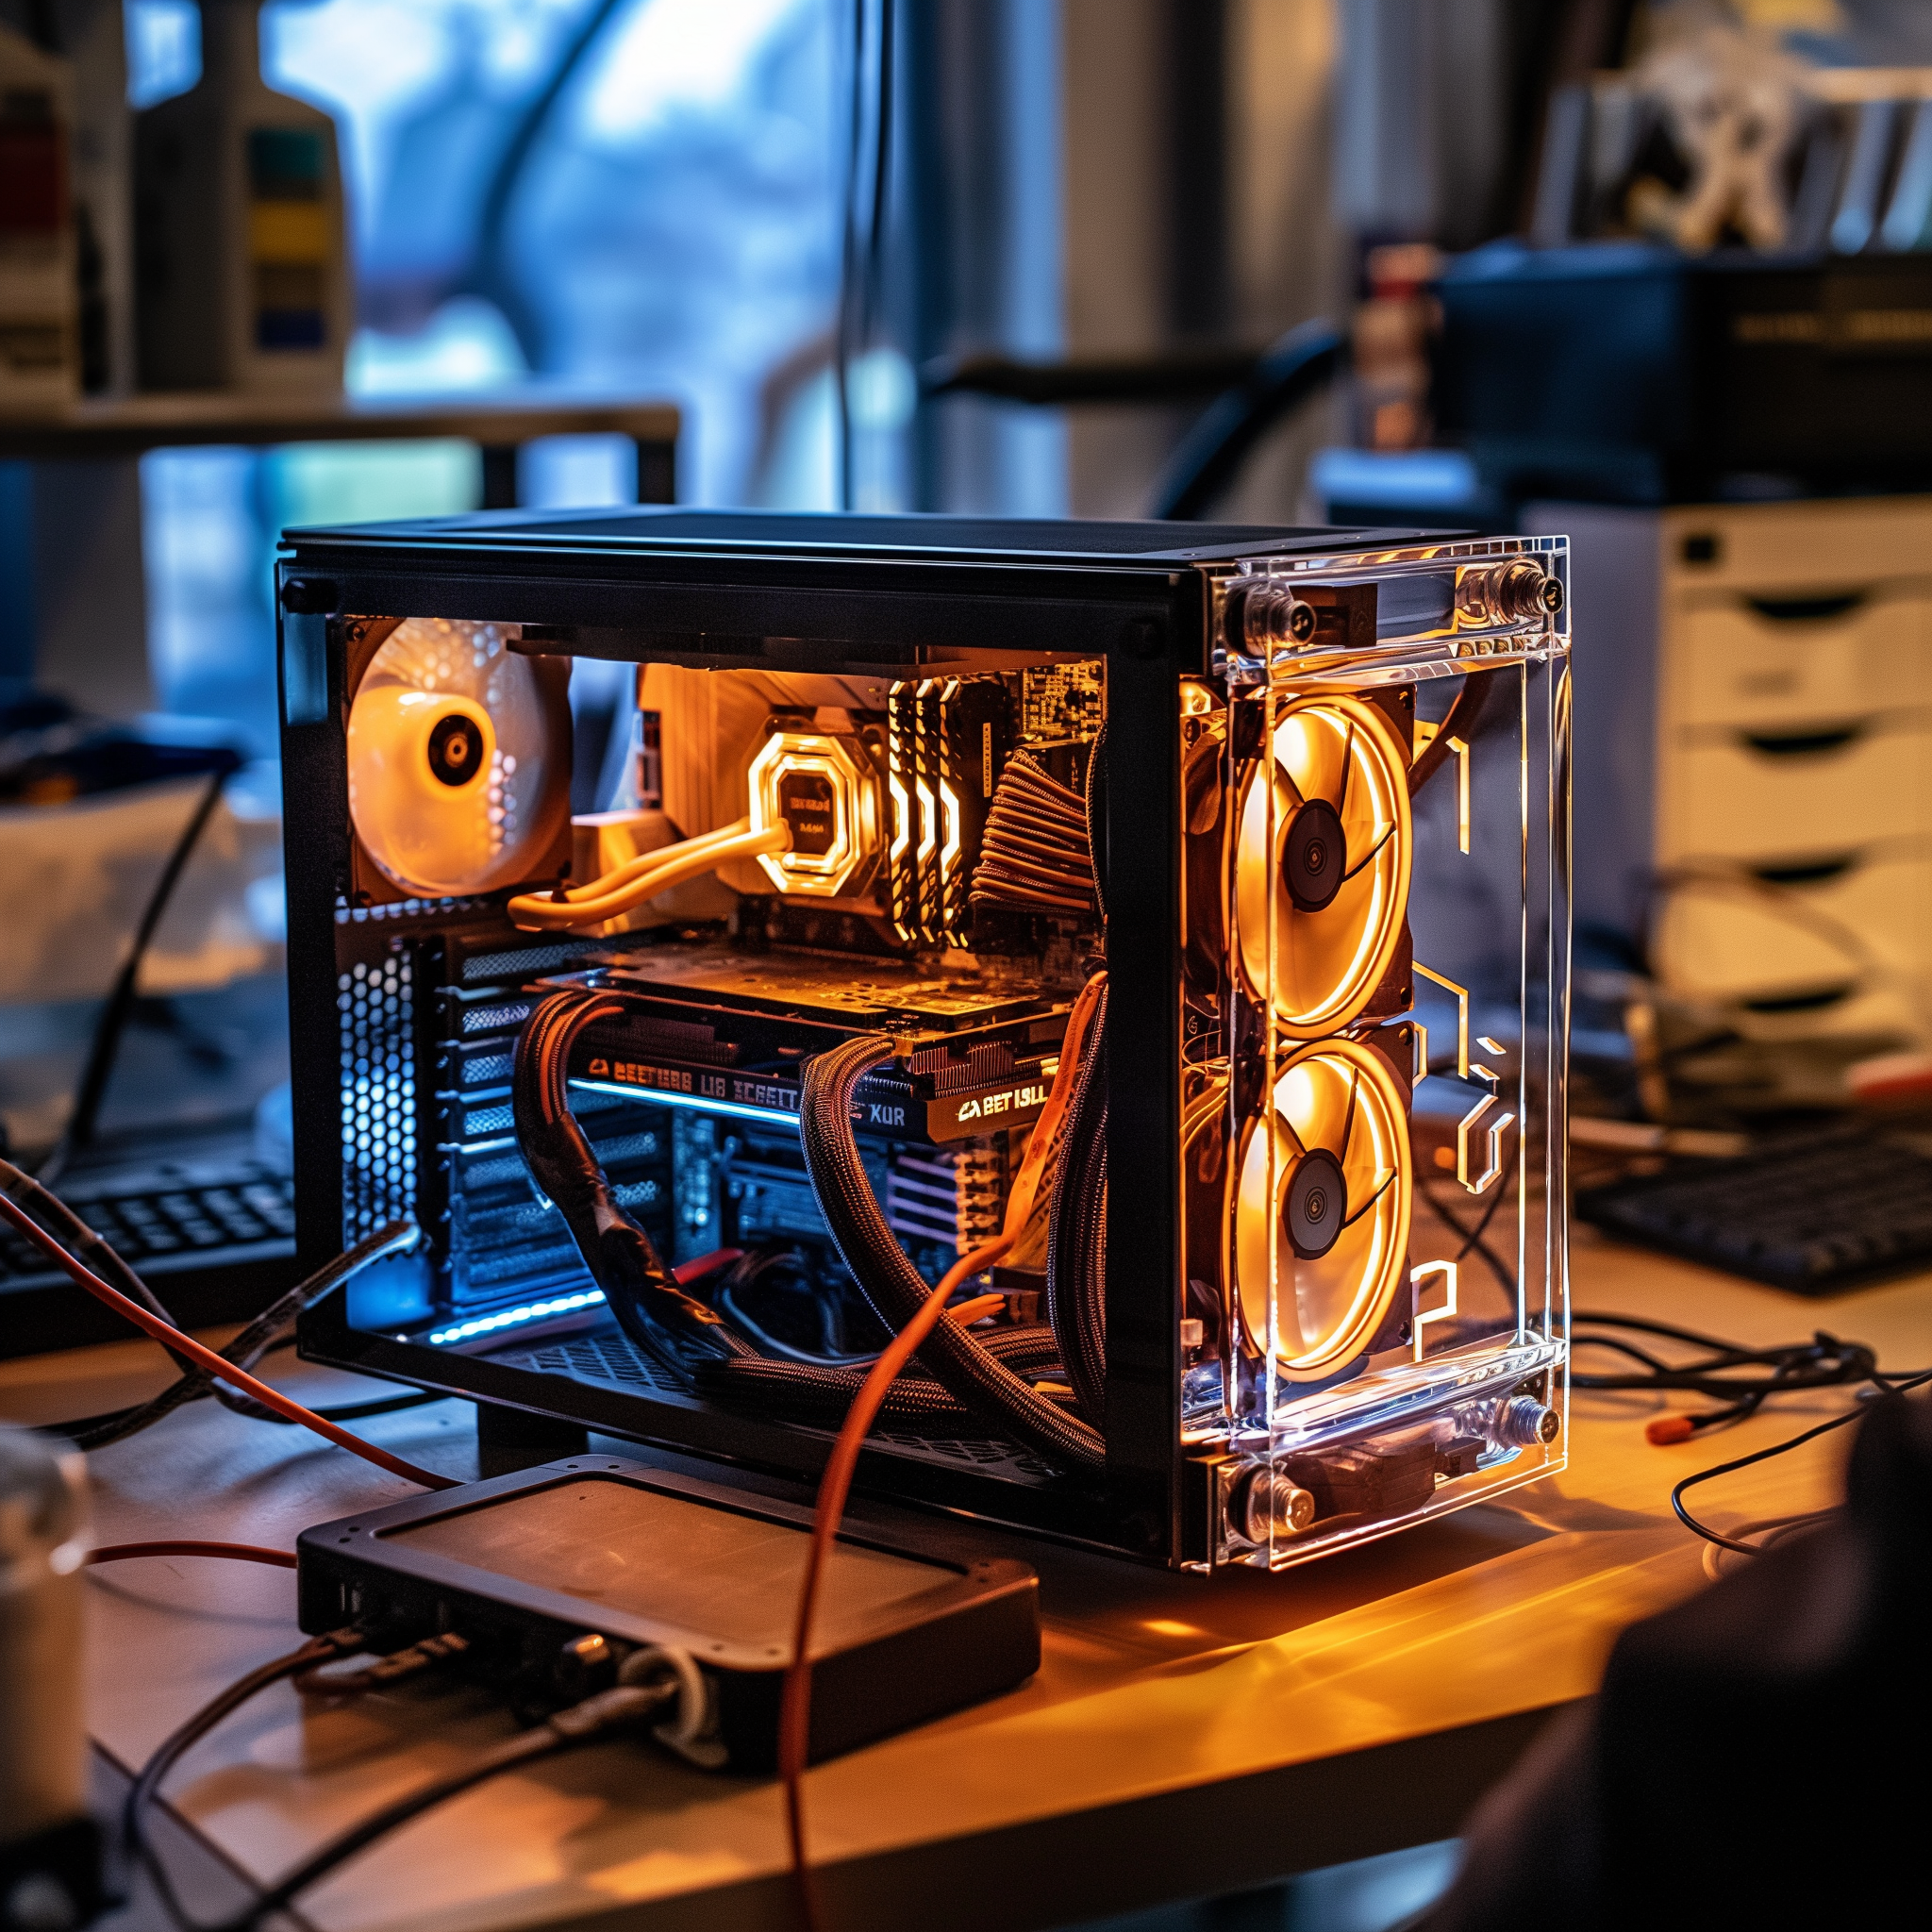
Why I Started Investigating My Home Server’s Power Usage
Running a home server is a great way to self-host services, store data, and experiment with different technologies. However, after monitoring my power consumption, I noticed my server was drawing more power than I expected. To dig deeper, I turned to PowerTOP, a powerful tool for analyzing power usage on Linux systems. This blog post is the first of a two-part series where I explore how PowerTOP works and how you can use it to optimize power consumption.
What is PowerTOP?
PowerTOP is an open-source Linux tool developed by Intel to analyze and optimize power consumption. It helps identify power-hungry processes, inefficient hardware settings, and offers suggestions to improve battery life (on laptops) or reduce energy usage (on servers and desktops).
PowerTOP provides a real-time view of how power is being used by different components, including the CPU, PCI devices, SATA interfaces, USB devices, and more. It also provides tuning recommendations that can be applied manually or automatically.
Installing PowerTOP
PowerTOP is available in most Linux distributions. To install it, use the package manager for your distribution:
Ubuntu / Debian
sudo apt update
sudo apt install powertop
Fedora
sudo dnf install powertopArch Linux
sudo pacman -S powertopCentOS / RHEL
sudo yum install powertopRunning PowerTOP
Once installed, you can start PowerTOP with the following command:
sudo powertopSince PowerTOP needs root privileges to access hardware metrics, running it with sudo is necessary.
For better accuracy, you can allow PowerTOP to collect calibration data:
sudo powertop --calibrateNote: Calibration can take a few minutes, during which your system may experience temporary performance drops as PowerTOP tests different power states.
Navigating PowerTOP
PowerTOP is a terminal-based tool with a text-based UI. Once launched, you can navigate using the arrow keys or TAB key. The tool consists of several tabs:
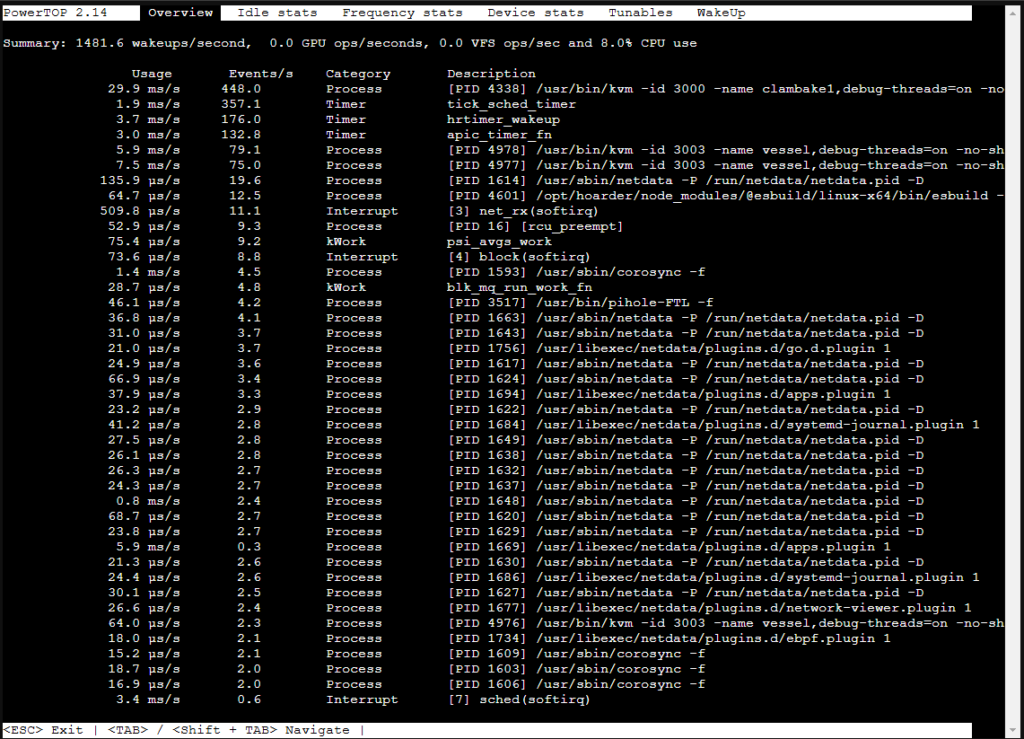
1. Overview Tab
This is the default view when you start PowerTOP. It shows:
- CPU usage (how much time the CPU spends in different power states)
- Power estimates for various processes
- Wakeups per second (indicating what’s keeping your CPU busy)
2. Idle Stats Tab
This tab provides information on CPU idle states (C-states). Lower power states (C3, C6, C7) save more energy but may introduce latency when waking up. If your CPU isn’t entering deep sleep states, it could indicate a power inefficiency.
3. Frequency Stats Tab
Shows how much time the CPU spends at different clock frequencies. If the CPU is frequently running at a high frequency even when idle, it may be consuming unnecessary power.
4. Device Stats Tab
Lists hardware devices (USB, PCI, SATA, network adapters) and their power consumption. This is useful for identifying which hardware components are not power-efficient.
5. Tunables Tab
This is the most important section for power optimization. It provides recommendations on settings that can reduce power consumption, marked as Good (optimized) or Bad (needs improvement). Some tunables require manual adjustments, while others can be applied instantly.
Next Steps: Applying Power-Saving Settings Permanently
Now that we understand how PowerTOP works, the next step is to apply its recommendations permanently. In Part 2 of this series, I’ll walk through configuring power-saving settings to persist across reboots, setting up systemd services, and fine-tuning options for maximum efficiency.
Stay tuned!